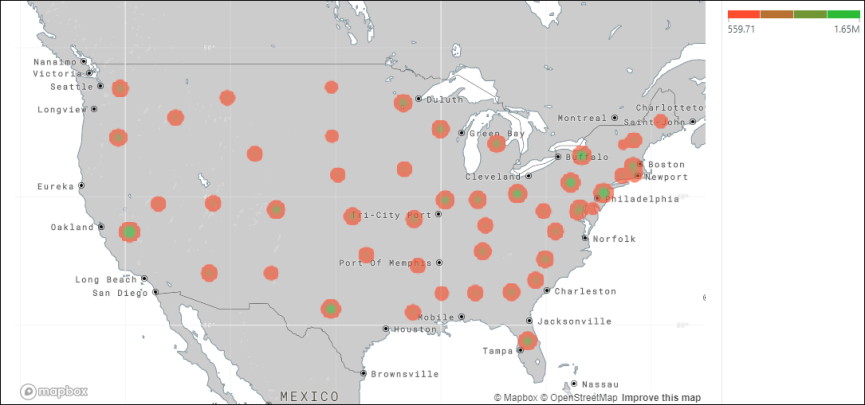
Use the geo heat map to represent the map's measure as a range of colors. Unlike the shape map, the geo heat map represents data as bubbles. The size of the bubble indicates the value of the measure, while the colors represent the range of the measure's values over a geographical location. The heat map below displays sales by state, ranging from 559 (red) to 1.65 million (green).
Build a Geocode Geo Heat Map
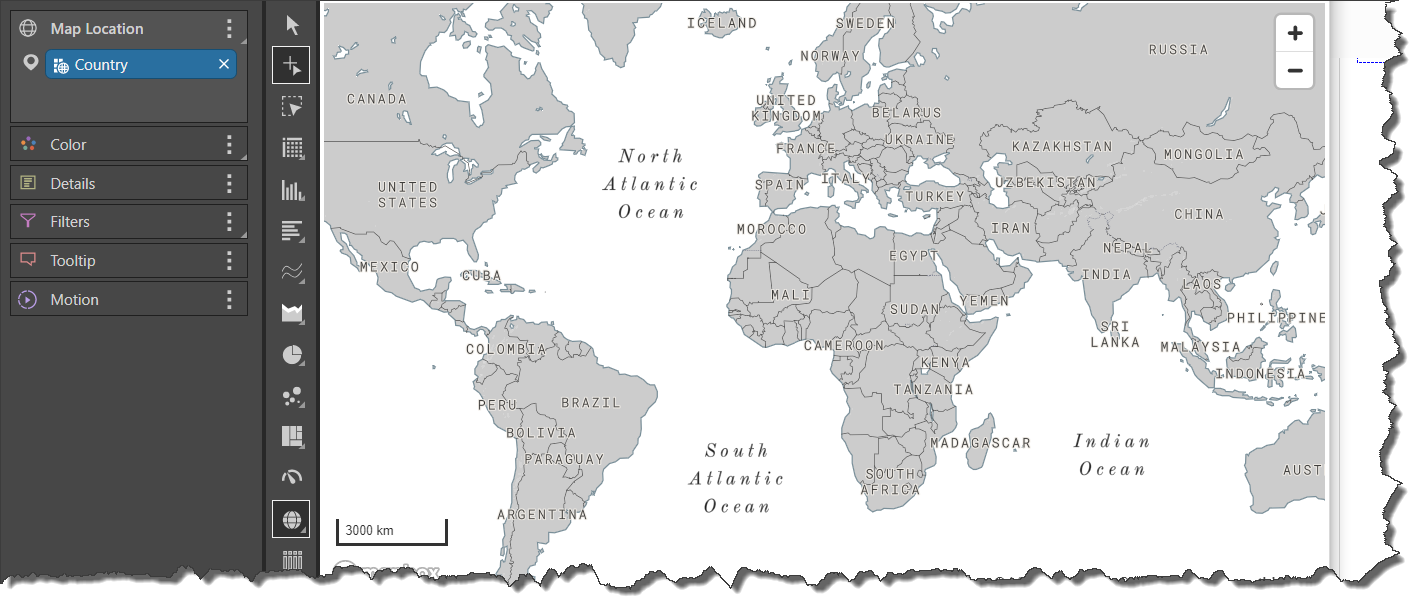
Geocode maps convert geospatial descriptions (like city, country, etc), into geographical locations on the map. Adding geospatial hierarchies such as Country, whose member elements describe locations (country names) results in a geocoded map.
Step 1
Add the Country hierarchy to the Map Location zone; a map will be generated with no data represented.
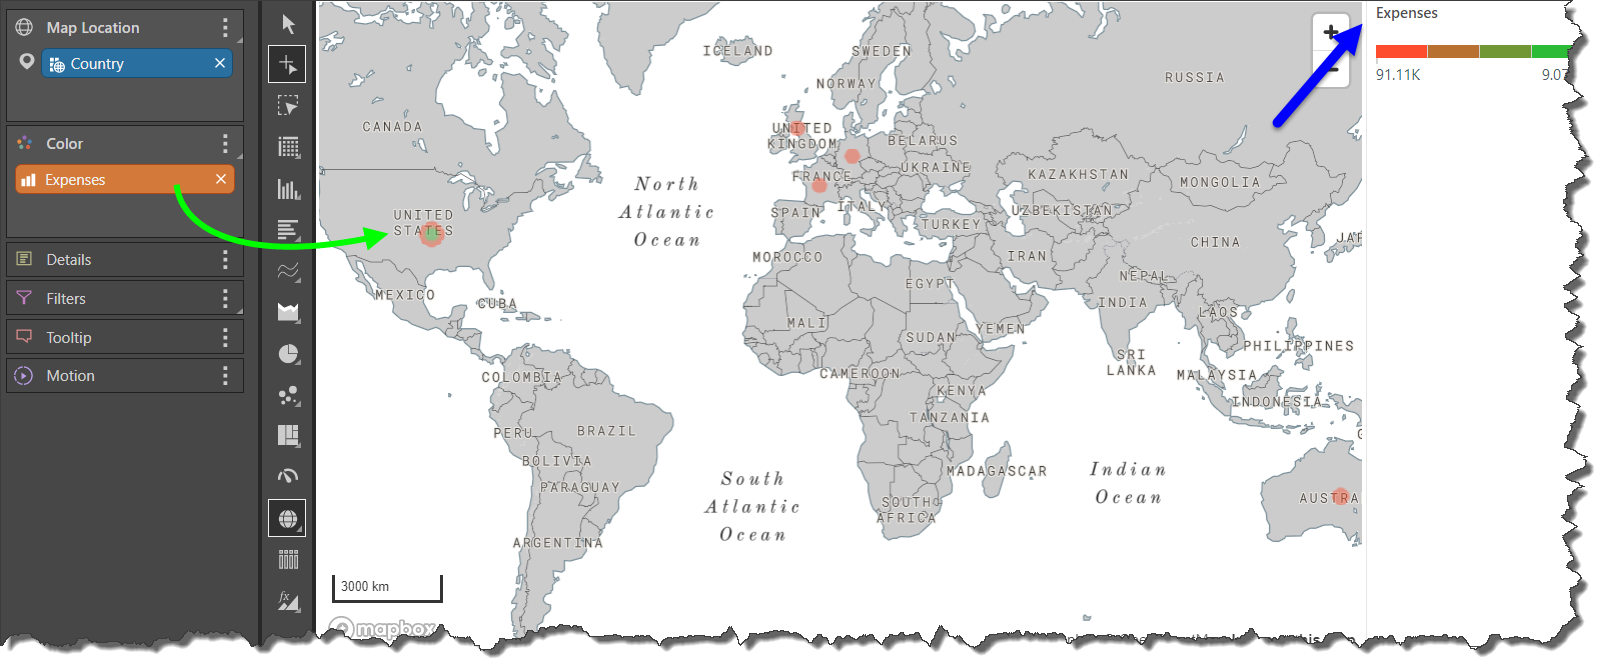
Step 2
To populate the geo heat map with data, you must add a measure to the Color zone; this measure will drive the color logic in the map, thus creating the 'heat' effect.
Add the Expenses measure to Color to add a heat bubble to each country in the query (green arrow). The heat map key can be read from the Expenses legend (blue arrow).
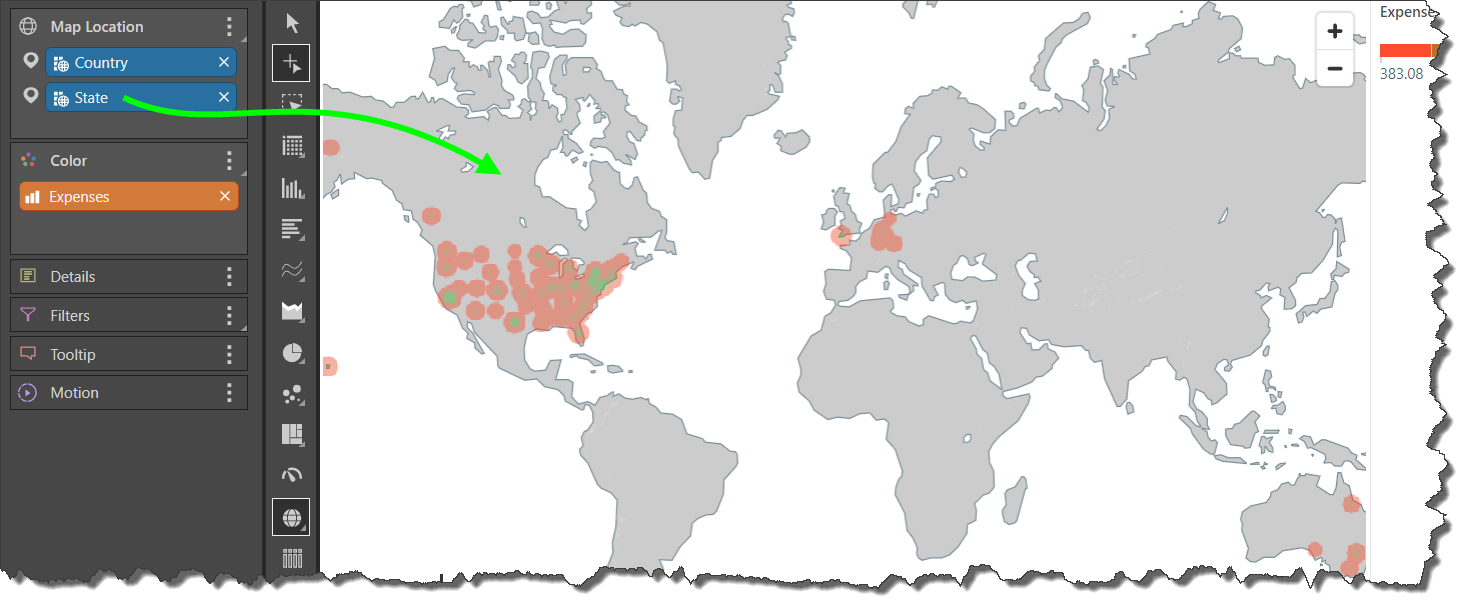
Step 3
You can add multiple geospatial hierarchies to the Map Location zone to display data for a 'lower' level. Here, the State hierarchy was added (green arrow); a heat bubble is added to each state in the query whose parent country is also in the query.
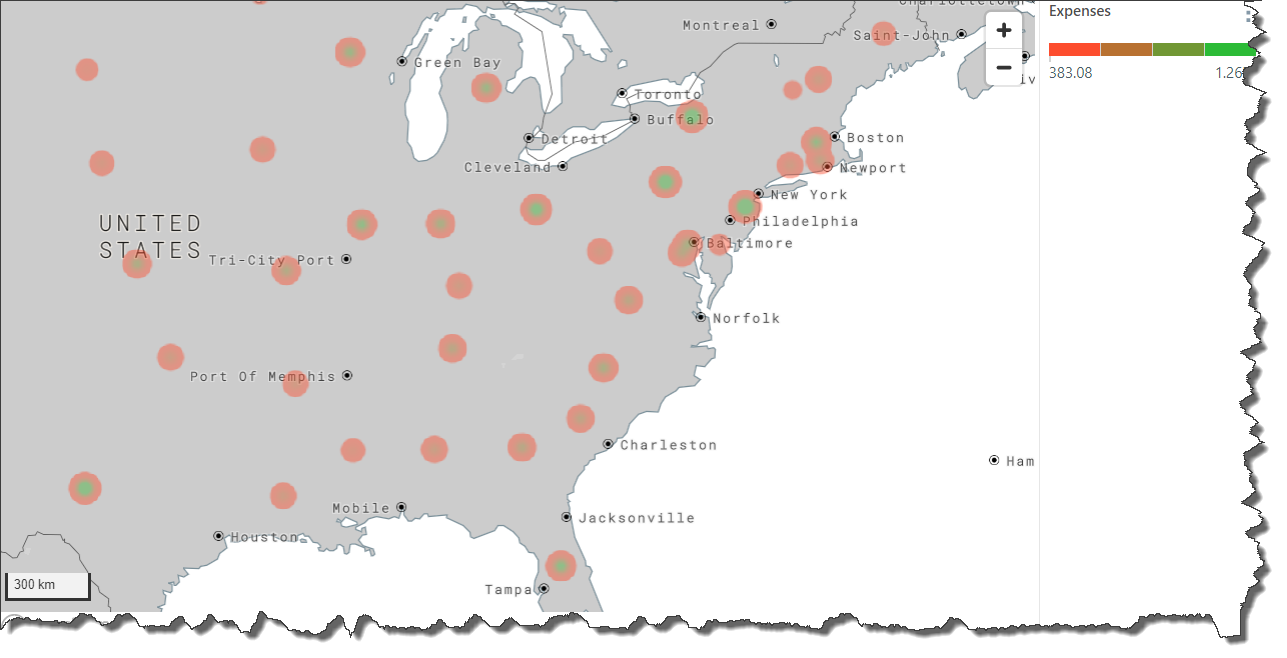
Zoom in to get a closer look at each state:
Build a Latitude/ Longitude Geo Heat Map
If your data model contains latitude and longitude measures, these can be used to generate latitude/ longitude maps.
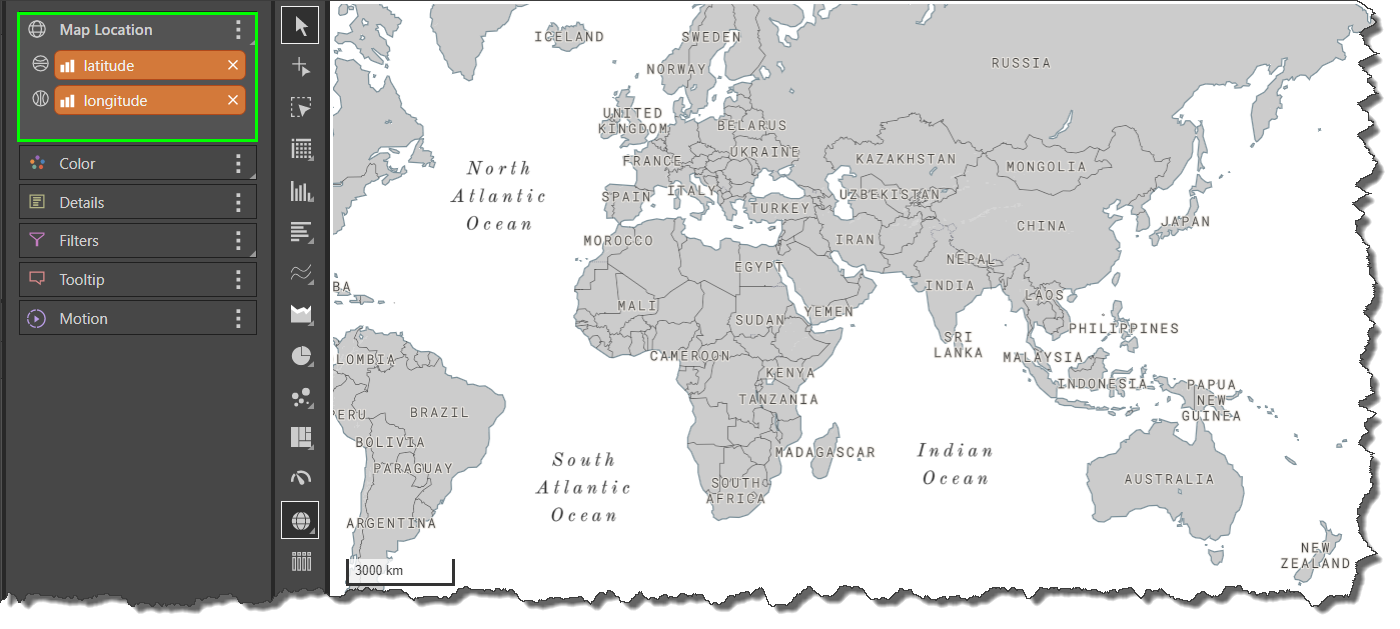
Step 1
Add the Latitude and Longitude measures to the Map Location zone (green highlight below).
Step 2
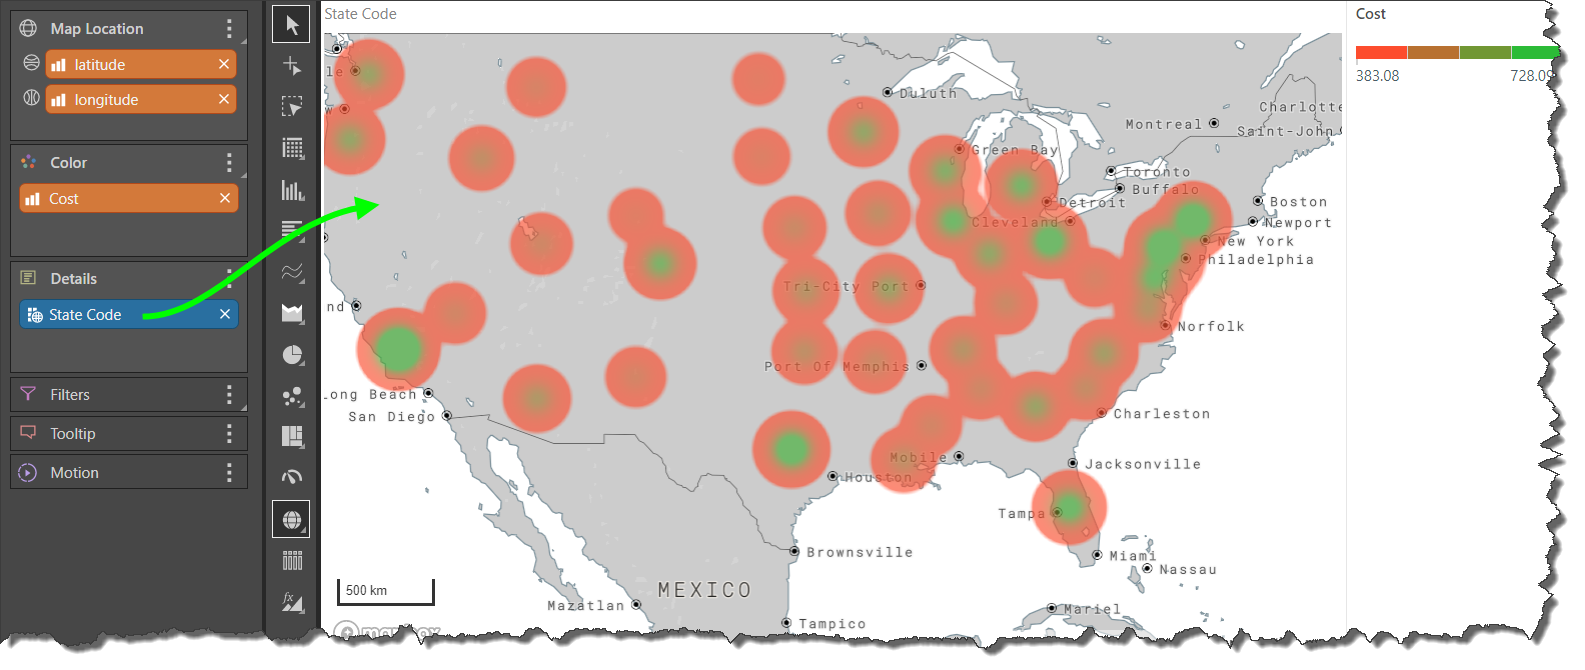
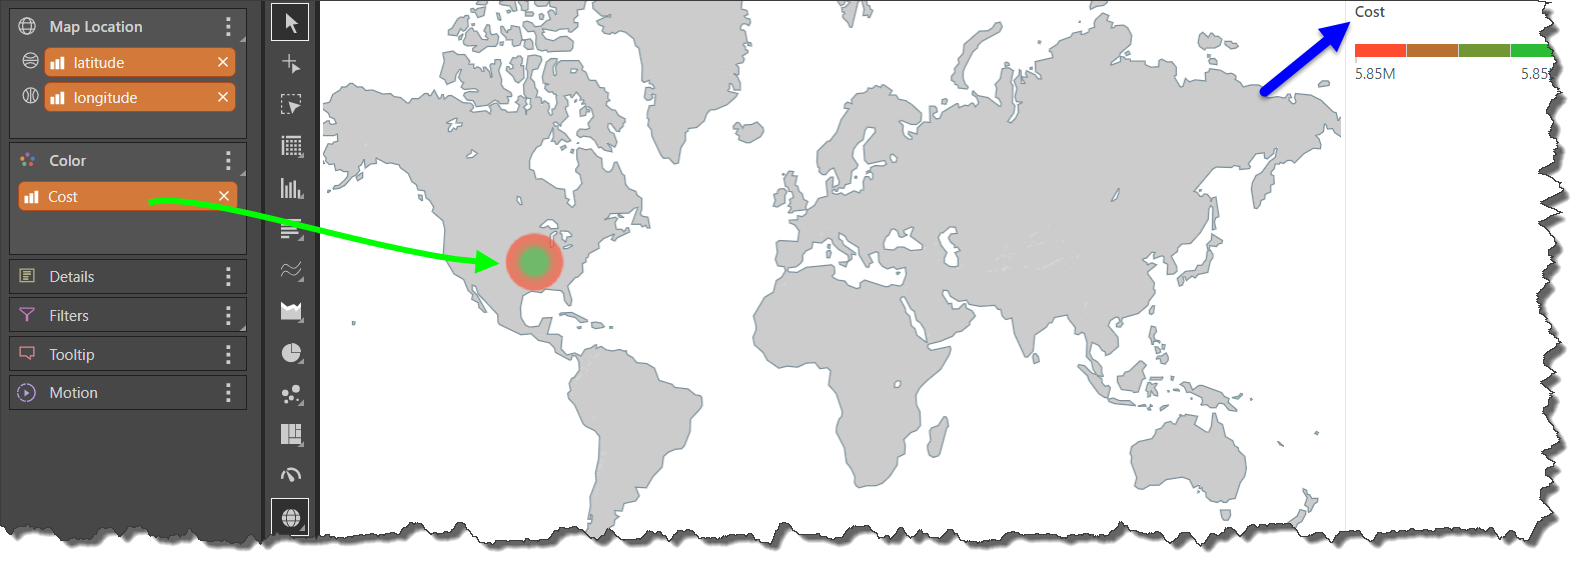
To populate the map with data, add a third measure to the Color zone; this will drive the 'heat' logic. Here, Cost was added (green arrow); the heat key can be read from the Cost legend (blue arrow).
Because latitude and longitude are aggregated measures, at this point we see cost for an aggregation of all latitude and longitude coordinates:
Step 3
A hierarchy containing unique identifiers that correspond to the latitude and longitude coordinates must be added to the Details zone to define the locations for which data should be presented. This hierarchy could be a list or countries or addresses, for example, or it may be a list of numeric or string IDs.
In this case, State Code was added to the Details zone (green arrow); latitude and longitude coordinate that has a corresponding state code in the data set is represented by a heat bubble.